Real examples from real trades
These are one trader's own trades, split the way QuantLogic splits yours. Some conditions helped, some cost money. Most samples are small, so nothing here is proven: QuantLogic checks a split against shuffled trades before calling it more than luck.
PF is the profit factor: money won divided by money lost. Above 1 made money, below 1 lost it.
Beats luck is the badge QuantLogic shows when a split holds up against shuffled trades.
1 / 5
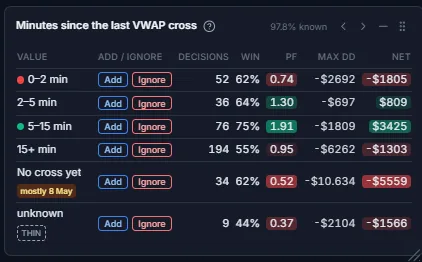
Minutes since the last VWAP cross
Entering right after price crossed VWAP cost money. Waiting 5 to 15 minutes did better.
- 5 to 15 minutes after a cross
- 76 trades · 75% wins · PF 1.91
- 0 to 2 minutes after a cross
- 52 trades · 62% wins · PF 0.74
- 15+ minutes
- 194 trades · PF 0.95
Larger samples, still checked against luck before anything is called an edge.
2 / 5
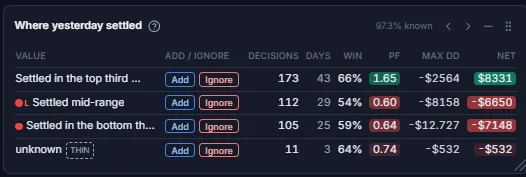
Where yesterday settled
The same trader made money after strong settlements and lost after the others.
- Settled in the top third of the range
- 173 trades · 66% wins · PF 1.65
- Mid-range
- 112 trades · PF 0.60
- Bottom third
- 105 trades · PF 0.64
Larger samples, still checked against luck before anything is called an edge.
3 / 5
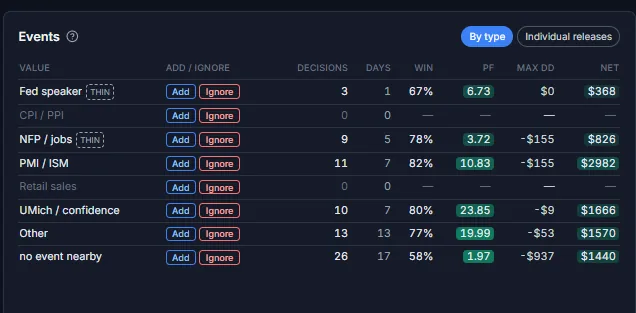
Economic releases
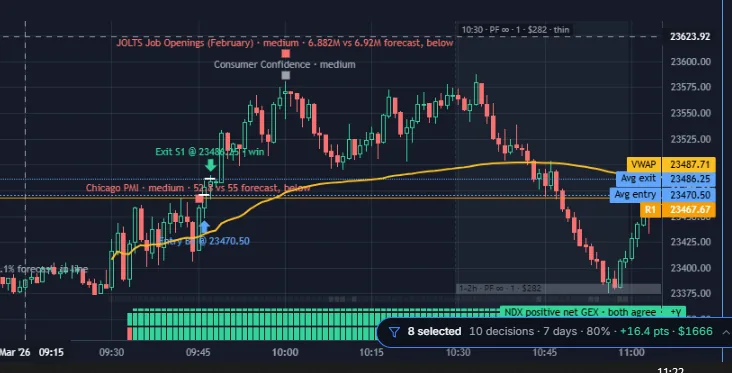
Trades taken near a scheduled economic release did better than trades with no event nearby. One of them: a long right after the 9:45 ET Chicago PMI, out about 16 points higher minutes later.
- Near a release
- PF 3.7 to 23.9 · 67% to 82% wins
- No event nearby
- 26 trades · 58% wins · PF 1.97
Small samples: 3 to 13 trades per event type. Not proven yet.
4 / 5
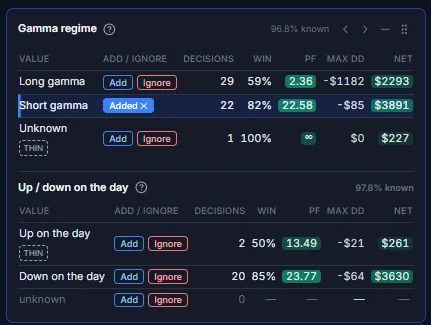
Gamma regime
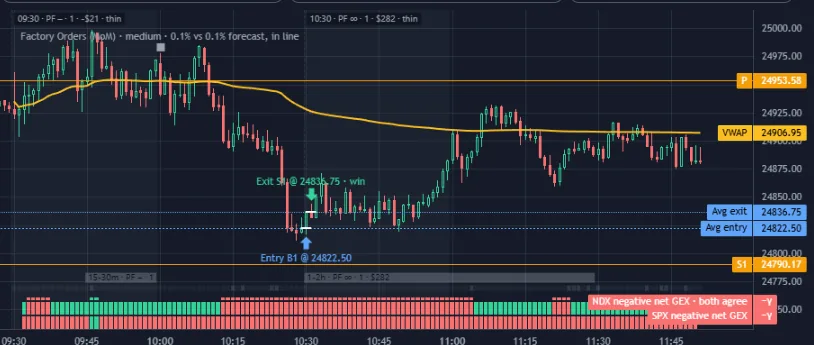
Trades taken when net gamma was negative did better than when it was positive. One of them: a long on a down day with NDX and SPX net gamma both negative, out about 14 points higher.
- Short gamma (net gamma negative)
- 22 trades · 82% wins · PF 22.6
- Long gamma (net gamma positive)
- 29 trades · 59% wins · PF 2.4
Small samples. Not proven yet.
5 / 5
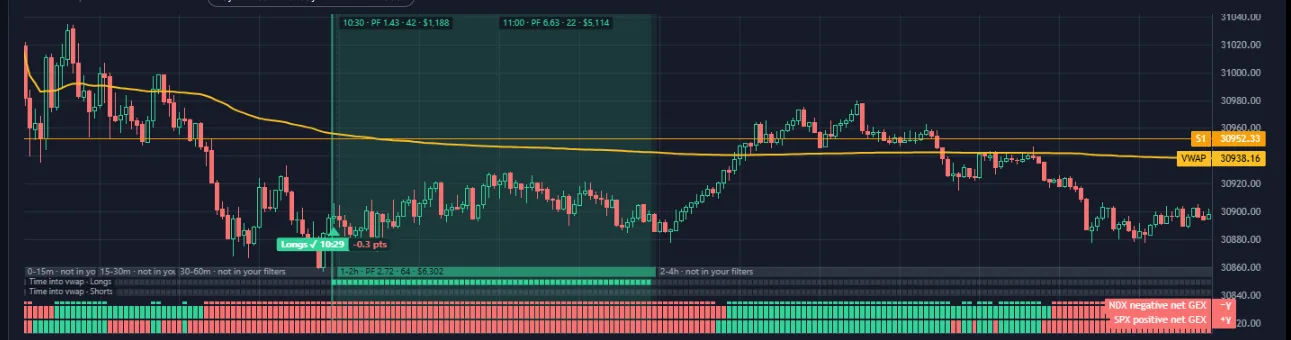
An indicator on the chart: Time into VWAP
The trader turned a data point into an indicator. On Monday 12 October at 10:29 ET it flagged a long on NQ about 70 points under VWAP; price was back at VWAP by 11:45.
One day, one indicator. Not a prediction.
Analyze your own trades like never before.
Your last 30 days on one account are free, no card.
One trader's real trades. Past results don't predict future ones. Not financial advice.