How to read the QuantLogic NQ indicator
A thin strip under the NQ chart turns green or red when several independent data points agree on one side of the market, and stays gray when they don't. On three years it never saw, common intraday ideas taken with it had a profit factor of 1.19 on longs and 1.11 on shorts, against about 0.95 without it. It is mixed about three minutes in four.
The question
The QuantLogic NQ indicator is a thin strip under the NQ chart. Each minute it checks whether several independent data points agree on the same side of the market. The data points come from our own research on nine years of NQ.
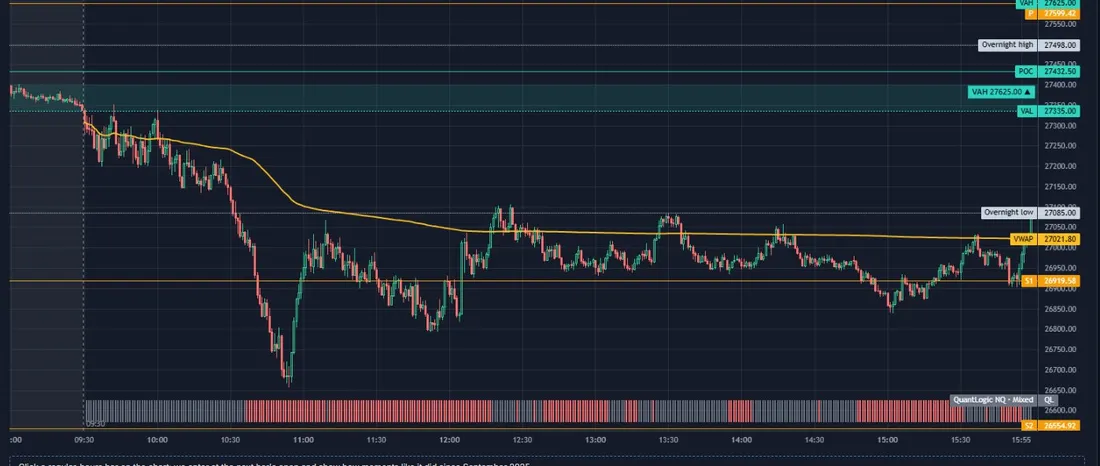
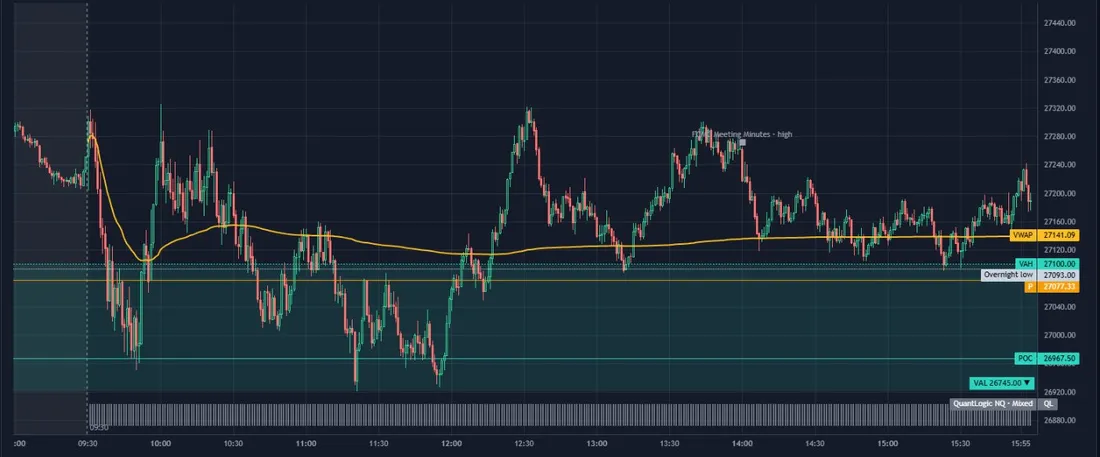
Green, long side: enough of them agree that buyers have the upper hand right now. Red, short side: enough of them agree that sellers have the upper hand. Gray, mixed: no clear agreement, the most common state.
It describes the market you are looking at. It is context for your own idea, never a trade call. In Build, its card tells you whether that side is with your trade or against it.
What we ran
- NQ, November 2017 to November 2026. The strip was set using November 2017 to October 2023 only, then checked on November 2023 to November 2026 without any change.
- Trade figures use 122 common intraday NQ ideas, long and short, each held up to 60 minutes with the same stop and target, 1 micro contract after costs.
- Profit factor is total gains divided by total losses: above 1.0 means gains were larger.
- Day figures cover 2,153 regular sessions, 9:30 to 16:00 ET.
Results
Held on years it never saw. Ideas taken when the strip agreed with them had a profit factor of 1.19 on longs and 1.11 on shorts from November 2023 to November 2026. Each of those years, longs: 1.12, 1.17, 1.24; shorts: 1.30, 0.95, 1.15. The same ideas without it: about 0.95.
Nine years. In every twelve-month period since November 2017, long trades taken on green gained more than they lost. On the short side, 5 of the 9 periods did.
Mixed most of the time. About 74% of the session minutes we checked were gray, with green and red about 13% each. 44% of sessions were almost entirely gray.
Early colour and the close. On the unseen years, when the strip showed red in the first 10 minutes, NQ closed below its 9:40 price on 64% of those days; with green, it closed above it on 66%. Across all days: 46% below, 54% above.
Here is what it looked like on six sessions in November 2026.
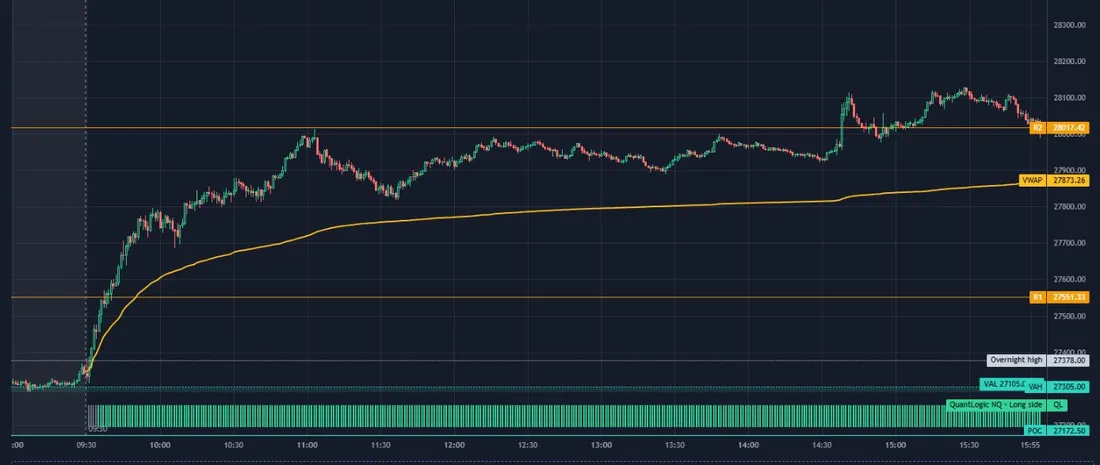
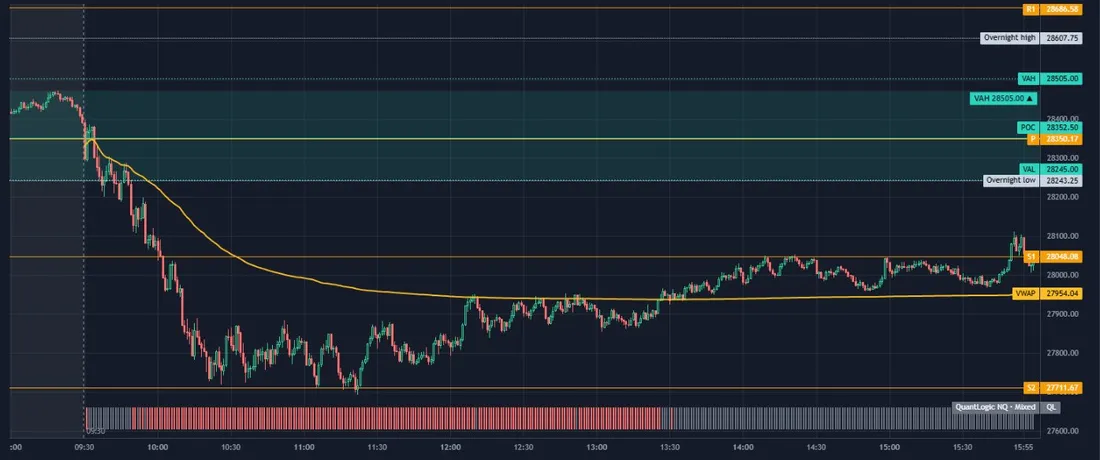
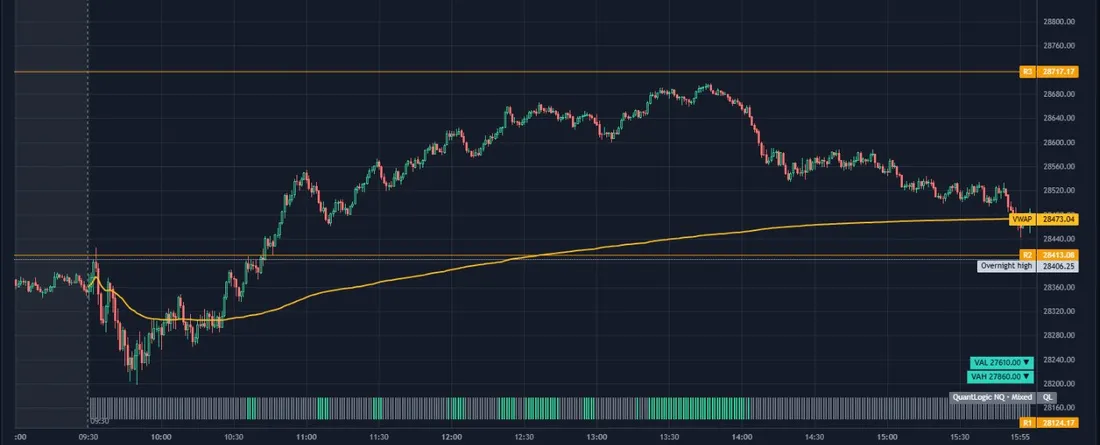
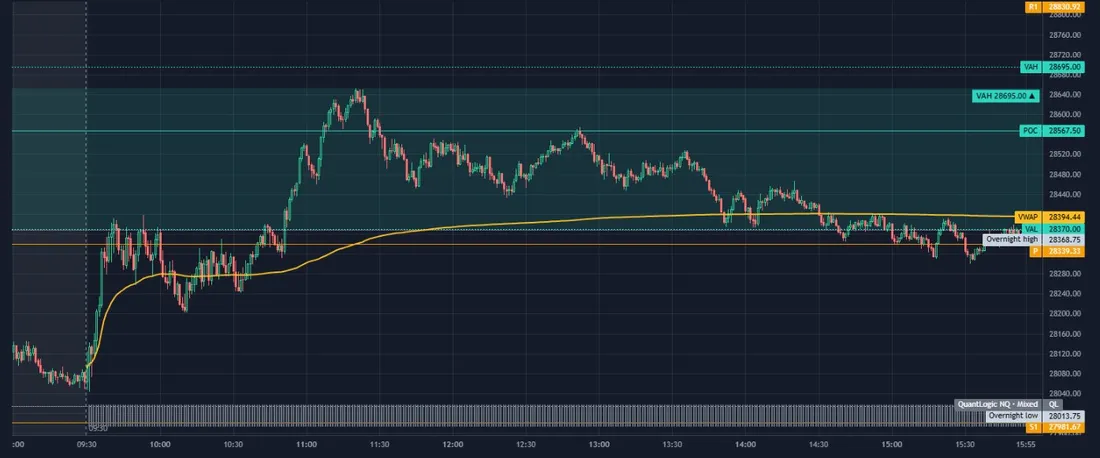
| Sessions | Days | Trend days | Closed with the colour |
|---|---|---|---|
| Almost all gray (under 10% coloured) | 957 | 22% | – |
| Partly coloured (10% to 30%) | 422 | 36% | – |
| Often coloured (30% to 60%) | 403 | 53% | 97% of the 775 days |
| Mostly one colour (over 60%) | 371 | 85% |
| First 10 minutes | Days, 2023–2026 | Points, 2023–2026 | Points, 2017–2023 |
|---|---|---|---|
| Some red | 75 | −52 | −18 |
| Some green | 82 | +59 | +15 |
| All days | 750 | +19 | +7 |
Colour in the first hour did not tell whether the rest of the day would trend: about the same share of afternoons trended after a gray first hour as after a coloured one.
Why it might be so
One reading on its own is often noise. When several independent readings agree that buyers or sellers are in control, a move tends to have more behind it.
Most of the time they don't agree, which is why gray is the usual state. Gray does not mean anything will happen; it means no side is clearly in control.
What it means when you test
Use it as context for an idea you already have: is the market on your trade's side right now, against it, or undecided?
Don't read colour as a reason to enter. The figures above come from ideas that had their own reason to trade; the strip only sorted them.
If you fade, colour against you is a reason to stand aside. Our note Don't fade into a trend shows why.
Limits
Not a signal. It does not tell you to buy or sell, when to enter, or how much to trade.
It has losing stretches. The short side lost in 4 of the 9 twelve-month periods, including November 2024 to October 2025. About a third of days with early red or green still closed the other way.
It changes minute to minute and can flip during a session. Mixed is normal: about three minutes in four are gray.
NQ only, and the past only. The data points behind it are our own research and are not listed here. Nothing guarantees any of this repeats.
Simulated results on past market data. Research only, not trading signals or advice. Past results do not promise future ones; see the hypothetical performance disclosure at the bottom of the page.
Get this note as a PDF
Leave your email and the PDF downloads straight away. Easy to keep, print or pass on.
Test your own ideas the same way
Analyze runs any idea on NQ, ES, gold, oil and Bitcoin with costs, both halves and a luck check, so you can see whether it beats chance before you trade it.
Past results on market data, not a forecast. No advice and no signals.
More research
We test the ideas traders talk about
Popular trading ideas tested after costs and against luck, including the ones that failed.
What AI can and can't find in trading
AI finds patterns, including ones that aren't there. Used honestly, it kills bad ideas before they cost you money, and it can still find small edges that last.
Don't fade into a trend
Over nine years of NQ, fades against a trend the indicator saw lost far more than fades on grey. The useful rule is the skip.
Skip the worst trades, don't pick the best ones
Leaving out the worst value of a data point carried a third less luck than keeping only the best, and kept 92% of the trades. More history shrank luck more than any rule.
Educational content, not investment advice. Futures trading involves substantial risk of loss. See the risk disclosure.